Property portfolio
The portfolio hub lists every asset with emissions intensity, energy use, and status at a glance. Users filter and sort to decide where to drill in next, and open a building without losing portfolio context.

This project is shared under a private link. Enter the passphrase to view the full case study.
This page always requires a passphrase (from the portfolio or if you open this file directly). You will be asked again on each visit. Client-side only — not a substitute for an NDA or server access control.
A data-driven platform transforming how commercial building owners track, benchmark, and plan emissions reduction — from portfolio overview to individual floor-level retrofits.
Commercial real estate accounts for a staggering share of global carbon output — yet the tools to manage and reduce these emissions remain fragmented, manual, and inaccessible.
Commercial buildings drive nearly 40% of global GHG emissions. Regulatory pressure is intensifying, yet most owners lack real-time visibility into their exposure or compliance status.
Owners juggle disconnected spreadsheets, manual audits, and siloed consultant reports. There's no unified system to track performance, benchmark against peers, or simulate retrofit scenarios.
Every retrofit involves tangled financial trade-offs, physical risk assessments, lease constraints, and long-term planning — requiring expensive experts at every step.
RetrofitX centralizes all sustainability intelligence — from raw building data to floor-level transition plans — into a single analytical workspace for asset managers.
Six integrated modules guide asset owners from initial data input to a fully costed, floor-level retrofit transition plan.
Ingest and structure building details, GHG emissions data, lease agreements, utility consumption, and financial records into a verified, auditable baseline.
Automated evaluation of building performance — surfacing emissions intensity, energy efficiency scores, and regulatory gap analysis through visual dashboards.
Compare against major asset owners — BlackRock, Embassy REIT, Brookfield — to understand relative positioning and identify what top performers do differently.
Define custom 5-year sustainability commitments aligned to net-zero pathways. Visualize milestones and track actuals vs. commitments in real time.
Evaluate exposure to climate-related physical risks — flooding, extreme heat, energy volatility — to prioritize which assets need the most urgent capital intervention.
Build a complete retrofit roadmap with granular floor-by-floor control. Assign individual strategies per floor — HVAC, envelope, lighting. Simulate emissions impact in real time. Compare scenarios side-by-side before committing capital.
Every user journey follows a structured path — from login through to a fully simulated, floor-level transition plan. Each step builds on the last.
Users securely access their RetrofitX workspace. New users are guided through portfolio onboarding. Existing users land on a personalized dashboard summarizing their portfolio's current state.
Users input comprehensive building information — structural details, GHG emissions by source, lease agreements, utility consumption, and financial records. RetrofitX structures this into a verified, auditable baseline for all subsequent analysis.
The platform generates a comprehensive current-state report: emissions intensity per m², energy efficiency scores, equivalent ratings, and gap analysis against compliance requirements. Complex data becomes immediately actionable.
RetrofitX benchmarks building performance against major asset owners including BlackRock, Embassy REIT, and Brookfield. Users gain immediate visibility into their relative ranking and identify the specific factors separating them from best-in-class.
Users define 5-year sustainability commitments aligned with net-zero pathways and internal ESG strategy. Targets are visualized as milestone curves with annual breakpoints, enabling ongoing progress tracking as retrofit activities are completed.
The platform evaluates each property's exposure to climate-related physical risks: extreme heat, flood probability, energy price volatility, and stranded asset risk. Outputs help prioritize which buildings require the most urgent intervention.
The final and most powerful step. Users build a complete retrofit transition plan with granular floor-by-floor customization. Each floor is assigned its own strategy. Real-time simulation projects the emissions impact of every decision. Multiple scenarios are compared side-by-side before a single dollar is spent.
Representative interfaces from the RetrofitX product — each with context for what the screen is for. Previews expand to the full height of each mockup.
The portfolio hub lists every asset with emissions intensity, energy use, and status at a glance. Users filter and sort to decide where to drill in next, and open a building without losing portfolio context.
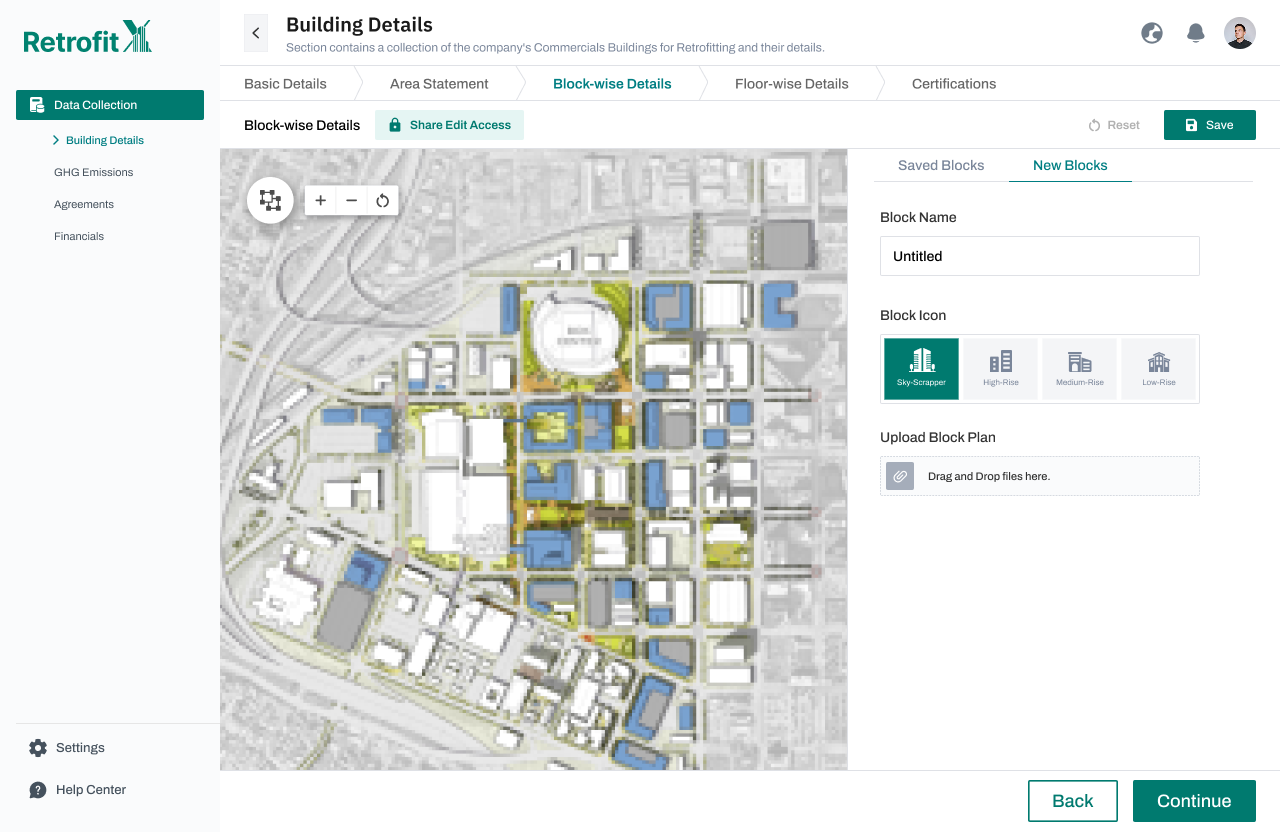
Structured capture of building data by block or wing: areas, systems, occupancy, and meter boundaries. This view keeps bulk entry efficient before users move to finer floor-level detail.
Floor-by-floor inputs mirror how operators think about tenancies and MEP zones. Completing this layer feeds accurate baselines for retrofit scenarios and regulatory reporting.

A consolidated read on how the asset performs today: scores, gaps versus policy, and headline KPIs. Designed so executives and asset managers align on “where we are” before debating “where we go.”

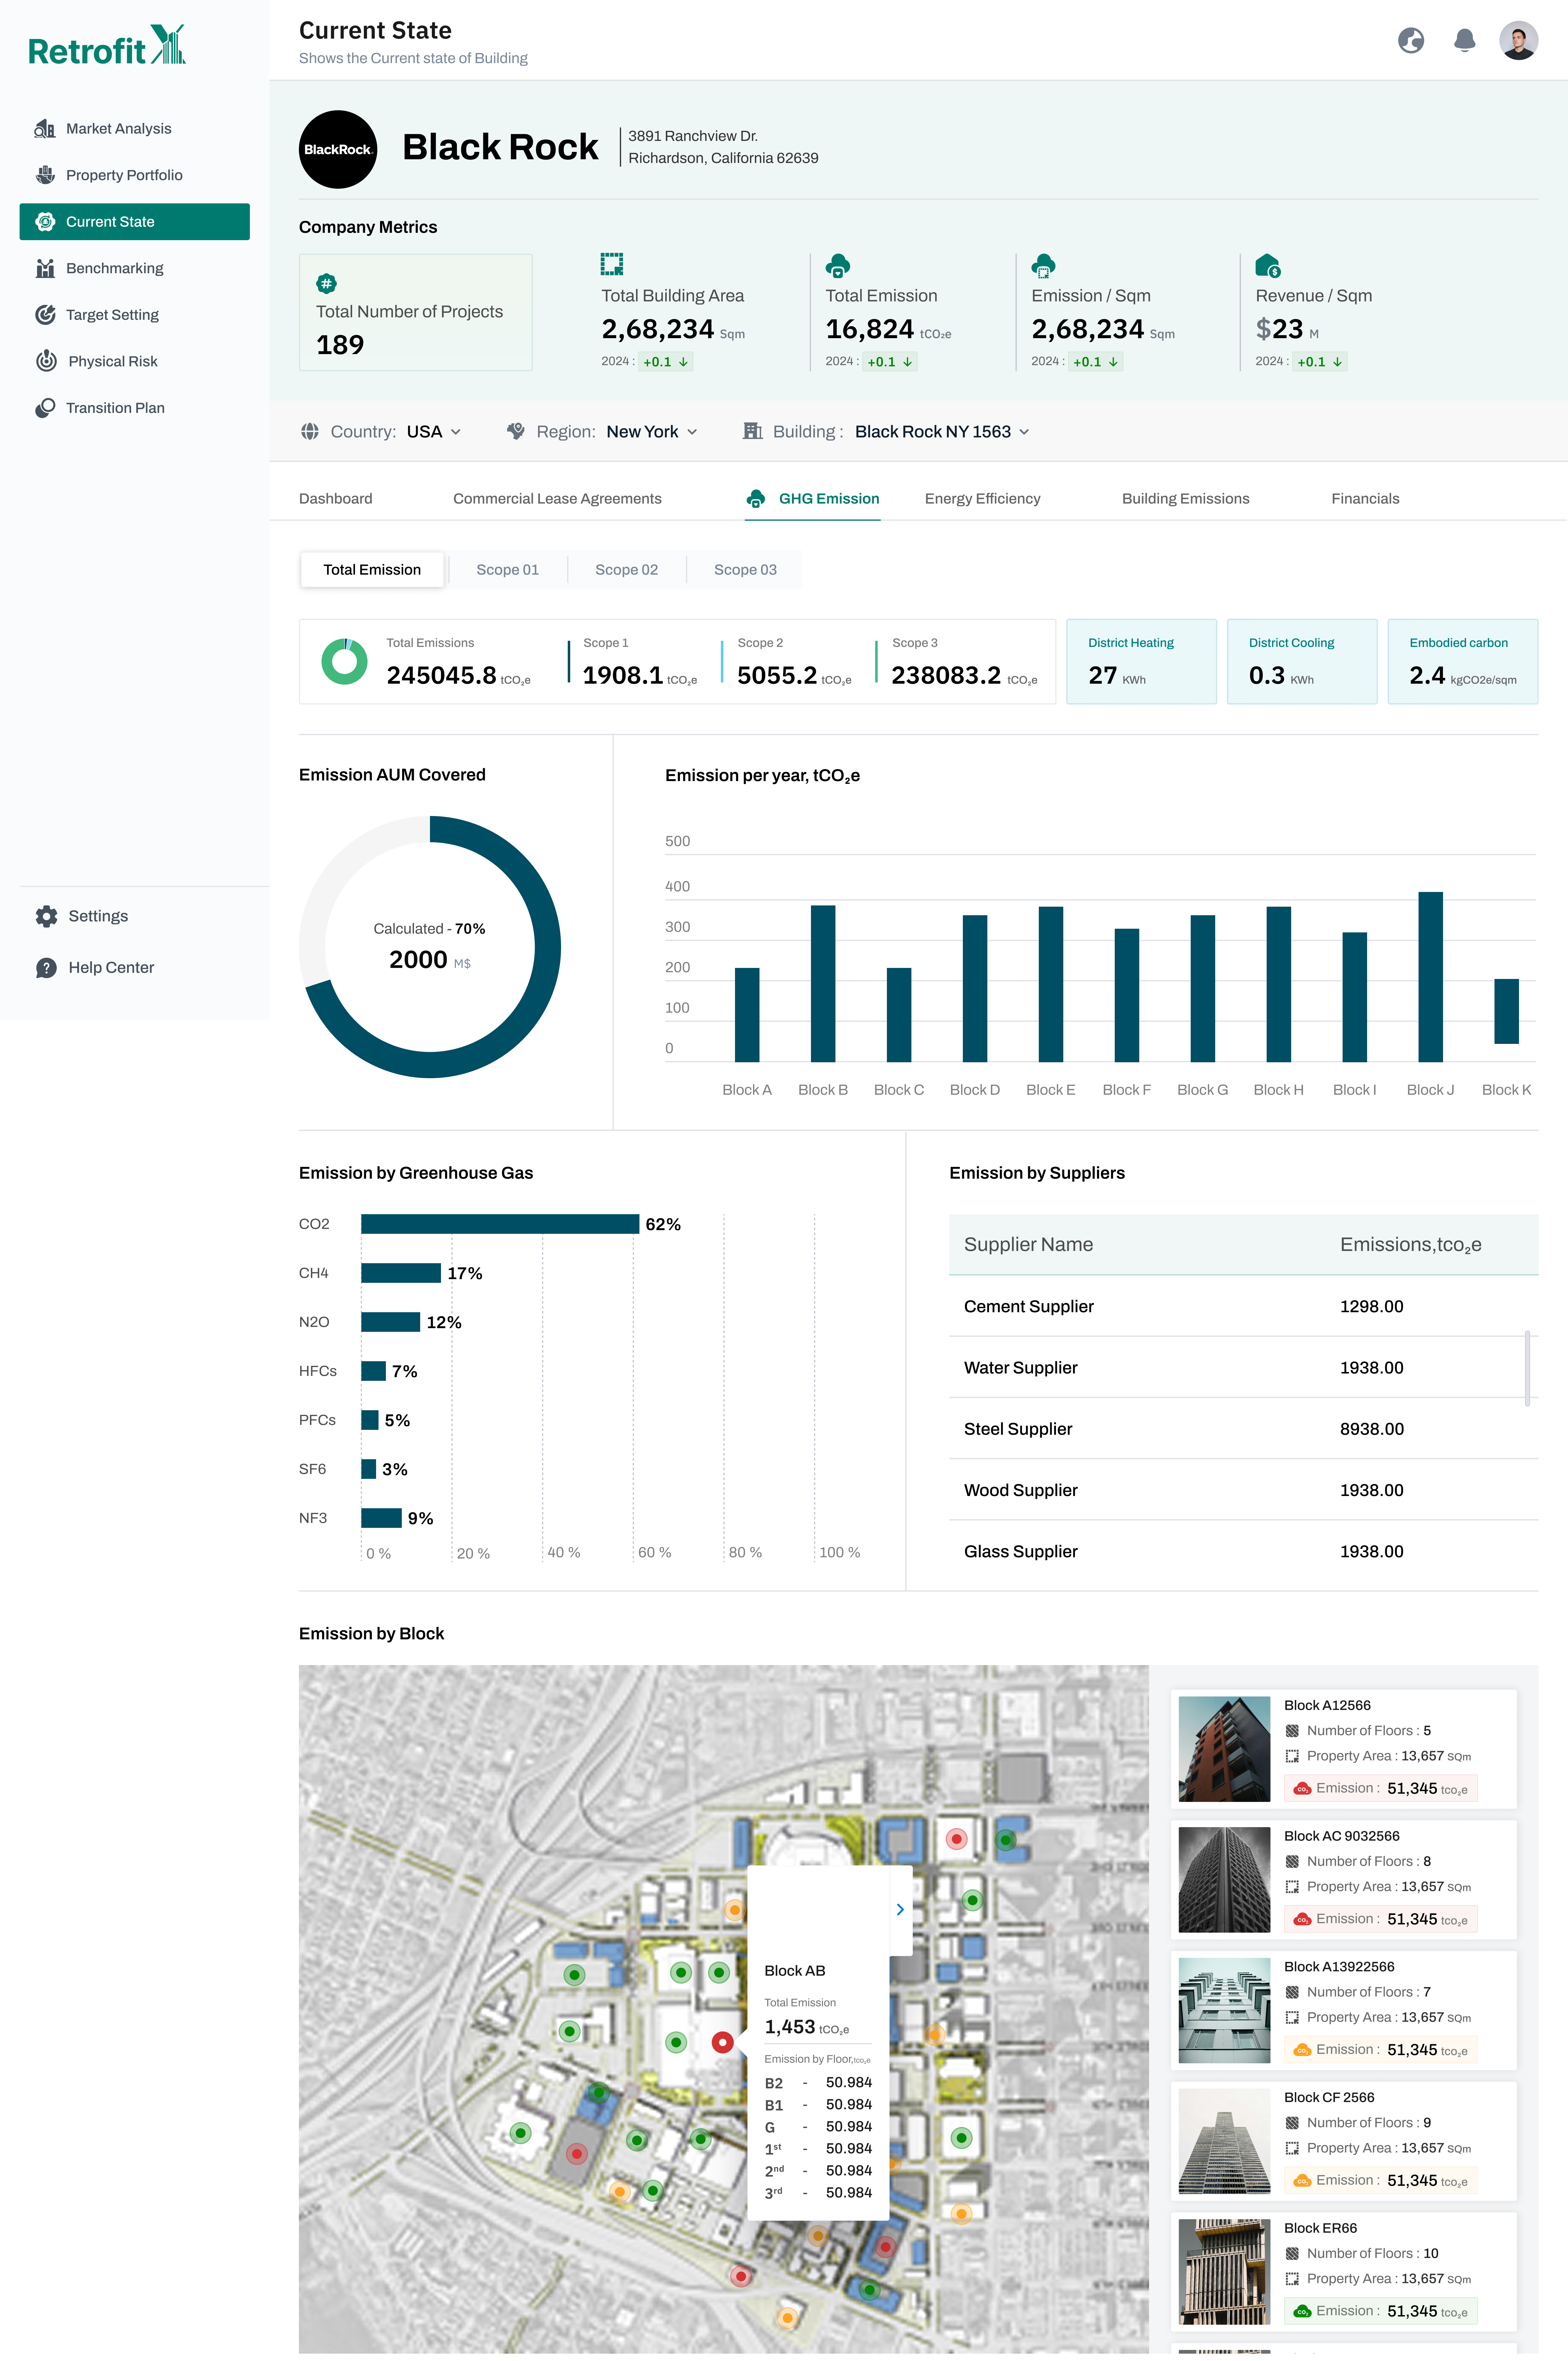
Scope-level breakdowns and charts tie activity data to tCO₂e. Teams use this screen to spot drivers of intensity and to validate that ingested data produces sensible totals.
Compares the portfolio to selected peers and market references. Relative ranking and gap callouts make it clear which metrics lag best-in-class and deserve program attention.

Users define science-aligned or custom reduction targets and see trajectory against a baseline. Milestones and years are explicit so progress can be tracked through each budget cycle.

Climate hazard signals—flood, heat, wind, and related stress—surface per property to inform capex prioritization and disclosure. Risk bands connect abstract models to actionable asset planning.

RetrofitX translates complex sustainability data into confident, executable decisions — across individual buildings and global portfolios.
Scenario simulation and benchmarking replace guesswork with evidence-based retrofit strategies that align financial and environmental goals.
Granular floor-level planning ensures every intervention targets the highest-impact areas for maximum measurable carbon reduction.
From a single property to a portfolio of hundreds — consistent data quality and insight at every scale.
Interactive charts, emission curves, and floor-plan visualizations turn raw data into immediate insight. Every metric is contextualised so users always understand what numbers mean for their assets.
Role-based dashboards surface the right information for asset managers, sustainability leads, and finance teams — all configurable without code. Live KPI tracking keeps every stakeholder aligned.
Model unlimited retrofit combinations before any capital commitment. Side-by-side scenario comparison with projected cost, payback period, and emissions reduction gives unparalleled confidence.
A structured interface language drawn from architectural drafting — precise, grid-based layouts with purposeful density that signals analytical rigor without sacrificing usability.